Replication package-Figures
Jochem Tolsma - Radboud University / University of Groningen, the Netherlands
Last compiled on november, 2023
Intro
This website is a replication package for the paper “Twitter and divides in the Dutch Parliament: Social and Political Segregation in the following, @-mentions and retweets networks” by Tolsma and Spierings ((submitted)).
It contains R code to replicate all Tables/Figures/Appendix in the manuscript.
To copy the code click the button in the upper right corner of the code-chunks.
Use the top menu to navigate to the section of interest.
The source code of this website can be found on Github
Questions can be addressed to Jochem Tolsma.
Packages
# install if necessary
if (!require("tidyverse", character.only = TRUE)) {
    install.packages("tidyverse", dependencies = TRUE)
}
if (!require("dplyr", character.only = TRUE)) {
    install.packages("dplyr", dependencies = TRUE)
}
if (!require("foreign", character.only = TRUE)) {
    install.packages("foreign", dependencies = TRUE)
}
if (!require("igraph", character.only = TRUE)) {
    install.packages("igraph", dependencies = TRUE)
}
if (!require("knitr", character.only = TRUE)) {
    install.packages("knitr", dependencies = TRUE)
}
if (!require("kableExtra", character.only = TRUE)) {
    install.packages("kableExtra", dependencies = TRUE)
}
if (!require("RSiena", character.only = TRUE)) {
    install.packages("RSiena", dependencies = TRUE)
}

# load packages.
library(tidyverse)
library(dplyr)
library(foreign)
library(igraph)
library(knitr)
library(kableExtra)
library(RSiena)
Load data objects
Data objects:
- key:
information on all politicians on election list
- twitter
- keyf: information on all 147 MPs with twitter handle
- mydata: RSiena object with all kind of goodies inside
- seats: seating coordinates of HoP (used for plotting)
- keyf: information on all 147 MPs with twitter handle
# STAP 1: read in data
key <- read.spss("data-processed\\key moederbestand 20171114.sav", use.value.labels = T, to.data.frame = T)


load("data-processed\\twitter_20190919.RData")
# str(twitter_20190919,1)
keyf <- twitter_20190919[[1]]
mydata <- twitter_20190919[[2]]
seats <- twitter_20190919[[3]]

fnet <- mydata$depvars$fnet  #following network
atmnet <- mydata$depvars$atmnet  #atmention network
rtnet <- mydata$depvars$rtnet  #retweet network

fnet1 <- fnet[, , 1]  #first wave
atmnet1 <- atmnet[, , 1]  #first wave
rtnet1 <- rtnet[, , 1]  #first wave

fnet1[fnet1 == 10] <- 0  #replace missings with 0 for plotting
atmnet1[atmnet1 == 10] <- 0  #replace missings with 0 for plotting
rtnet1[rtnet1 == 10] <- 0  #replace missings with 0 for plotting

# define undirected networks of reciprocated ties
fnet1_un <- fnet1 == 1 & t(fnet1) == 1
atmnet1_un <- atmnet1 == 1 & t(atmnet1) == 1
rtnet1_un <- rtnet1 == 1 & t(rtnet1) == 1

vrouw <- mydata$cCovars$vrouw
partij <- mydata$cCovars$partij
ethminz <- mydata$cCovars$ethminz
lft <- mydata$cCovars$lft

ethminz <- ethminz + attributes(ethminz)$mean
partij <- partij + attributes(partij)$mean
vrouw <- vrouw + attributes(vrouw)$mean
lft <- lft + attributes(lft)$mean
Build plots
The first step is to make a ‘graph object’.
# define directed network
G1d <- graph_from_adjacency_matrix(fnet1, mode = "directed", weighted = NULL, diag = TRUE, add.colnames = NA,
    add.rownames = NA)
G2d <- graph_from_adjacency_matrix(atmnet1, mode = "directed", weighted = NULL, diag = TRUE, add.colnames = NA,
    add.rownames = NA)
G3d <- graph_from_adjacency_matrix(rtnet1, mode = "directed", weighted = NULL, diag = TRUE, add.colnames = NA,
    add.rownames = NA)

# define undirected network
G1u <- graph_from_adjacency_matrix(fnet1_un, mode = "undirected", weighted = NULL, diag = TRUE, add.colnames = NA,
    add.rownames = NA)
G2u <- graph_from_adjacency_matrix(atmnet1_un, mode = "undirected", weighted = NULL, diag = TRUE, add.colnames = NA,
    add.rownames = NA)
G3u <- graph_from_adjacency_matrix(rtnet1_un, mode = "undirected", weighted = NULL, diag = TRUE, add.colnames = NA,
    add.rownames = NA)
Plots
Followers (directed)
FIXED LOCATIONS AS IN HoP
G1 <- G1d

E(G1)$curved = 0.1
E(G1)$arrow.size = 0.1
V(G1)$color <- keyf$Partij_col
V(G1)$size = degree(G1, mode = "out") * 0.1 + 6
V(G1)$label = ""

owncoords <- cbind(keyf$X, keyf$Y)
owncoords <- owncoords/8
owncoords[, 1] <- (owncoords[, 1] - mean(owncoords[, 1]))
owncoords[, 2] <- (owncoords[, 2] - mean(owncoords[, 2]))

# change color of edges based on intra or interparty ties for transparant black: #0000007D
edges <- get.adjacency(G1)
edges_mat <- matrix(as.numeric(edges), nrow = nrow(edges))
# edges_mat[lower.tri(edges_mat)] <- 0
teller <- 1
coloredges <- NA
for (i in 1:nrow(edges)) {
    for (j in 1:ncol(edges)) {
        if (edges_mat[i, j] == 1) {
            if (keyf$Partij_col[i] == keyf$Partij_col[j]) {
                coloredges[teller] <- keyf$Partij_col[i]
            }
            if (keyf$Partij_col[i] != keyf$Partij_col[j]) {
                coloredges[teller] <- "#0000001B"
            }
            teller <- teller + 1
        }
    }
}
E(G1)$color = coloredges

# prepare a legend
Party_names <- unique(keyf$Partij)
Party_cols <- unique(keyf$Partij_col)

# reorder
Party_names <- Party_names[c(7, 3, 9, 10, 12, 11, 5, 4, 6, 2, 8, 1, 13)]
Party_cols <- Party_cols[c(7, 3, 9, 10, 12, 11, 5, 4, 6, 2, 8, 1, 13)]


# png('MPplotG1dv2.png',width = 900, height= 900)
{
    plot.igraph(G1, mode = "directed", layout = owncoords, rescale = F, margin = c(0, 0, 0, 0), xlim = c(min(owncoords[,
        1]), max(owncoords[, 1])), ylim = c(min(owncoords[, 2]), max(owncoords[, 2])), main = "Follower relations between Dutch MPs (2017)")

    legend("topleft", legend = Party_names, pch = 21, col = "#777777", pt.bg = Party_cols, pt.cex = 2,
        cex = 0.8, bty = "n", ncol = 3)

    text(-2.2, -1.2, "Note 1: Node size based on degree", adj = 0, cex = 0.8)
    text(-2.2, -1.3, "Note 2: Edge color based on Party of MPs, black if MPs from different party", adj = 0,
        cex = 0.8)
}
# dev.off()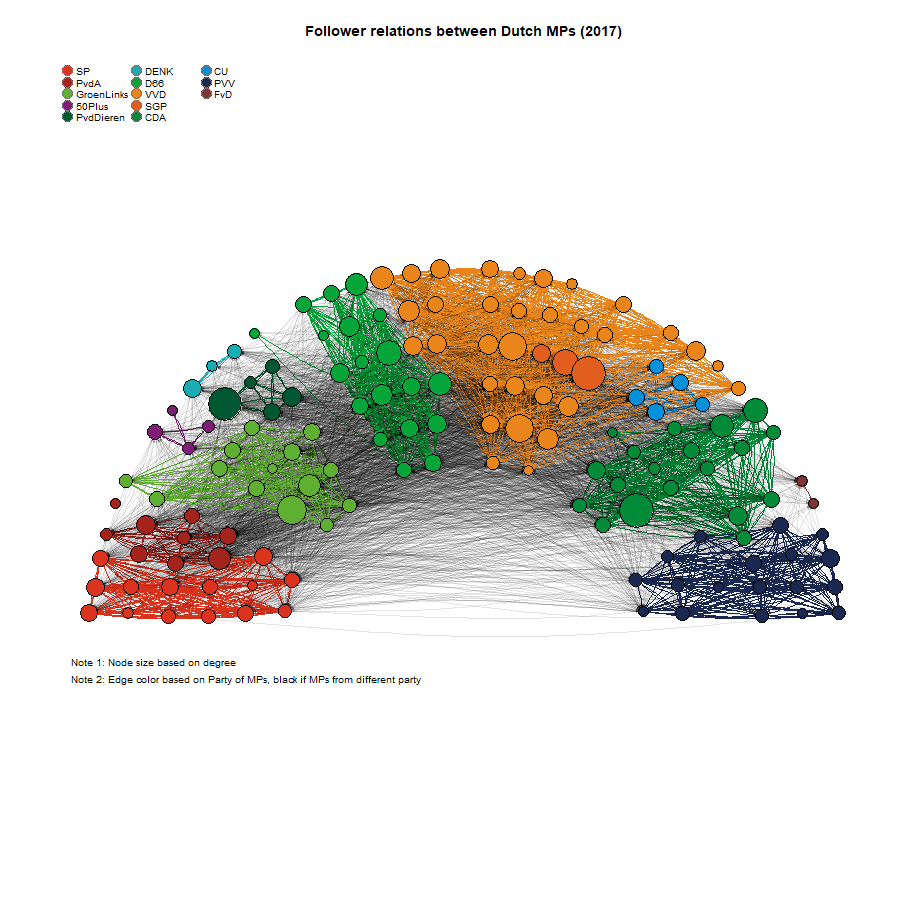
Fruchterman-Reingold layout algorithm
# change colors a bit
df_col <- col2rgb(V(G1)$color)
V(G1)$color2 <- rgb(t(df_col), alpha = 100, maxColorValue = 255)

df_col <- col2rgb(E(G1)$color)
E(G1)$color2 <- rgb(t(df_col), alpha = 100, maxColorValue = 255)
E(G1)$color2[which(E(G1)$color == "#0000001B")] <- "#00000010"

# remove isolates
Isolated = which(degree(G1) == 0)
G1_sel = delete.vertices(G1, Isolated)
# G2_sel = delete.vertices(G2_sel, c(72,27)) #only connected to each other

V(G1_sel)$color <- V(G1_sel)$color2
E(G1_sel)$color <- E(G1_sel)$color2

# smaller arrows
E(G1)$arrow.size = 0.01

# bit smaller
V(G1_sel)$size = 0.5 * V(G1_sel)$size

# layout
set.seed(2435675)
c4 = layout_with_fr(G1_sel)
# c4[72,1] <- 5 c4[27,1] <- 5.5


# plot

# png('RR_followers_directed.png',width = 900, height= 900)
{
    plot(G1_sel, layout = c4, margin = c(0, 0, 0, 0), main = "Followers relations between Dutch MPs (2017)")

    legend("topleft", legend = Party_names, pch = 21, col = "#777777", pt.bg = Party_cols, pt.cex = 2,
        cex = 0.8, bty = "n", ncol = 3)

    text(-1.2, -1.2, "Note 1: Node size based on degree", adj = 0, cex = 0.8)
    text(-1.2, -1.25, "Note 2: Edge colar based on Party of MPs, black if MPs from different party",
        adj = 0, cex = 0.8)
    text(-1.2, -1.3, "Note 3: Isolates removed", adj = 0, cex = 0.8)

}
# dev.off()

png("RR_followers_directedv2.png", width = 900, height = 900)
{
    plot(G1_sel, layout = c4, margin = c(0, 0, 0, 0))
}
dev.off()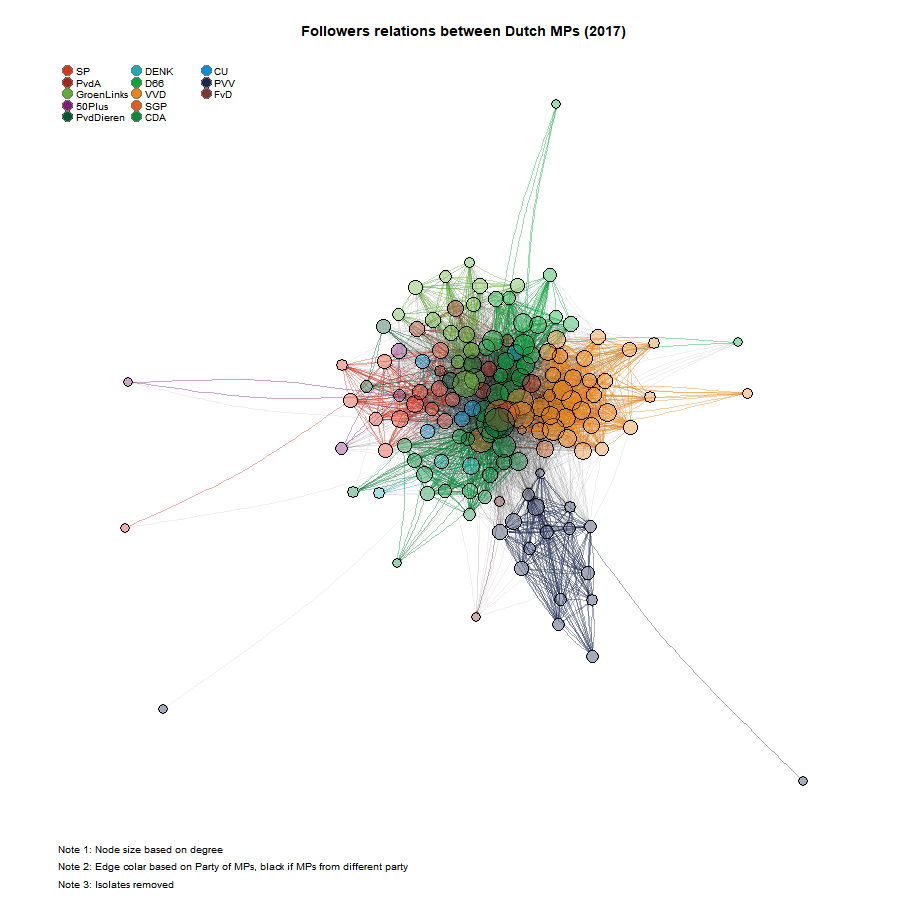
Followers (undirected)
FIXED LOCATIONS AS IN HoP
G1 <- G1u

E(G1)$curved = 0.1

V(G1)$color <- keyf$Partij_col
V(G1)$size = degree(G1) * 0.3 + 6
V(G1)$label = ""

owncoords <- cbind(keyf$X, keyf$Y)
owncoords <- owncoords/8
owncoords[, 1] <- (owncoords[, 1] - mean(owncoords[, 1]))
owncoords[, 2] <- (owncoords[, 2] - mean(owncoords[, 2]))

# change color of edges based on intra or interparty ties for transparant black: #0000007D
edges <- get.adjacency(G1)
edges_mat <- matrix(as.numeric(edges), nrow = nrow(edges))
edges_mat[lower.tri(edges_mat)] <- 0
teller <- 1
coloredges <- NA
for (i in 1:nrow(edges)) {
    for (j in 1:ncol(edges)) {
        if (edges_mat[i, j] == 1) {
            if (keyf$Partij_col[i] == keyf$Partij_col[j]) {
                coloredges[teller] <- keyf$Partij_col[i]
            }
            if (keyf$Partij_col[i] != keyf$Partij_col[j]) {
                coloredges[teller] <- "#0000004B"
            }
            teller <- teller + 1
        }
    }
}
E(G1)$color = coloredges

# prepare a legend
Party_names <- unique(keyf$Partij)
Party_cols <- unique(keyf$Partij_col)

# reorder
Party_names <- Party_names[c(7, 3, 9, 10, 12, 11, 5, 4, 6, 2, 8, 1, 13)]
Party_cols <- Party_cols[c(7, 3, 9, 10, 12, 11, 5, 4, 6, 2, 8, 1, 13)]

# png('MPplotG1uv2.png',width = 900, height= 900)
{
    plot.igraph(G1, mode = "undirected", layout = owncoords, rescale = F, margin = c(0, 0, 0, 0), xlim = c(min(owncoords[,
        1]), max(owncoords[, 1])), ylim = c(min(owncoords[, 2]), max(owncoords[, 2])), main = "Reciprocated follower relations between Dutch MPs (2017)")

    legend("topleft", legend = Party_names, pch = 21, col = "#777777", pt.bg = Party_cols, pt.cex = 2,
        cex = 0.8, bty = "n", ncol = 3)

    text(-2.2, -1.2, "Note 1: Node size based on degree", adj = 0, cex = 0.8)
    text(-2.2, -1.3, "Note 2: Edge color based on Party of MPs, black if MPs from different party", adj = 0,
        cex = 0.8)
}
# dev.off()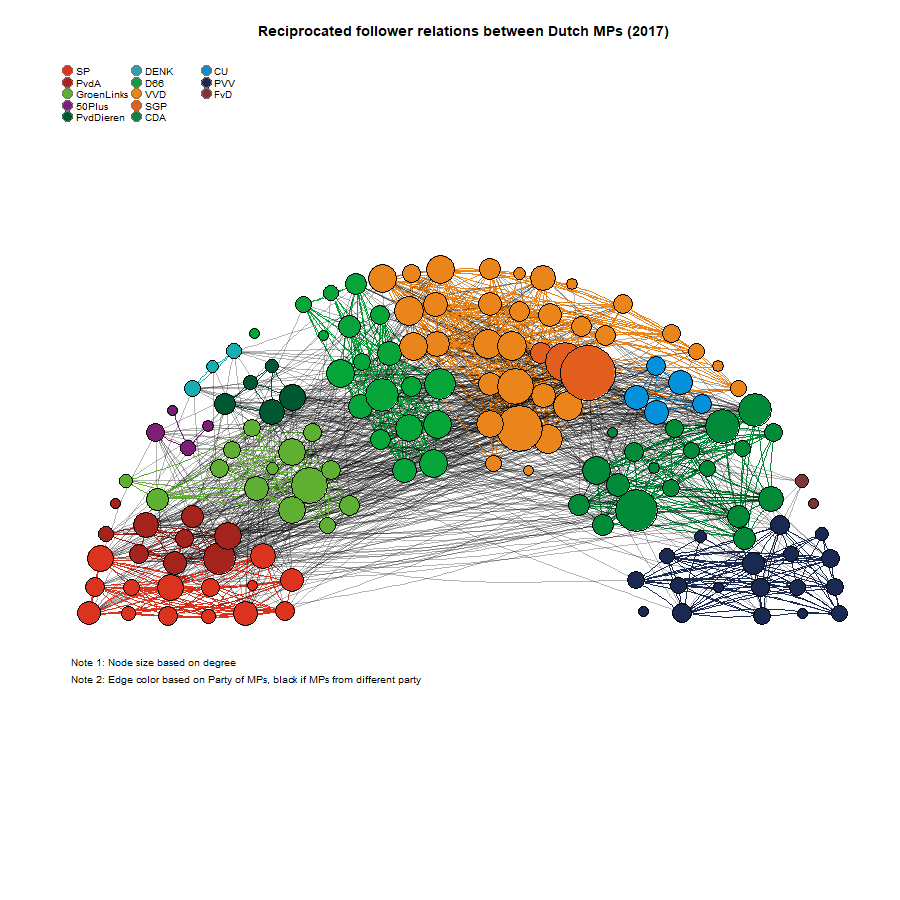
Fruchterman-Reingold layout algorithm
# change colors a bit
df_col <- col2rgb(V(G1)$color)
V(G1)$color2 <- rgb(t(df_col), alpha = 100, maxColorValue = 255)

df_col <- col2rgb(E(G1)$color)
E(G1)$color2 <- rgb(t(df_col), alpha = 100, maxColorValue = 255)
E(G1)$color2[which(E(G1)$color == "#0000004B")] <- "#00000010"

# remove isolates
Isolated = which(degree(G1) == 0)
G1_sel = delete.vertices(G1, Isolated)
# G2_sel = delete.vertices(G2_sel, c(72,27)) #only connected to each other

V(G1_sel)$color <- V(G1_sel)$color2
E(G1_sel)$color <- E(G1_sel)$color2

# smaller arrows
E(G1)$arrow.size = 0.01

# bit smaller
V(G1_sel)$size = 0.5 * V(G1_sel)$size

# layout
set.seed(2435675)
c4 = layout_with_fr(G1_sel)
# c4[72,1] <- 5 c4[27,1] <- 5.5

# plot

# png('RR_followers_undirected.png',width = 900, height= 900)
{
    plot(G1_sel, layout = c4, margin = c(0, 0, 0, 0), main = "Reciprocated followers relations between Dutch MPs (2017)")

    legend("topleft", legend = Party_names, pch = 21, col = "#777777", pt.bg = Party_cols, pt.cex = 2,
        cex = 0.8, bty = "n", ncol = 3)

    text(-1.2, -1.2, "Note 1: Node size based on degree", adj = 0, cex = 0.8)
    text(-1.2, -1.25, "Note 2: Edge colar based on Party of MPs, black if MPs from different party",
        adj = 0, cex = 0.8)
    text(-1.2, -1.3, "Note 3: Isolates removed", adj = 0, cex = 0.8)

}
# dev.off()

png("RR_followers_undirectedv2.png", width = 900, height = 900)
{
    plot(G1_sel, layout = c4, margin = c(0, 0, 0, 0))
}
dev.off()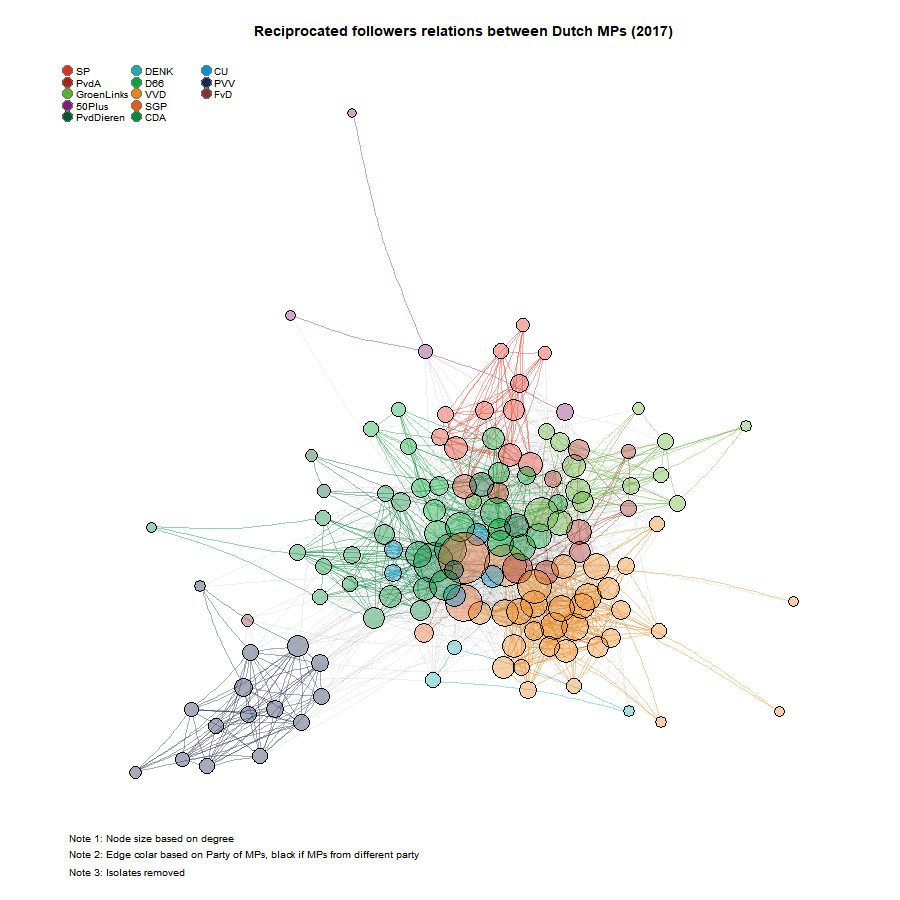
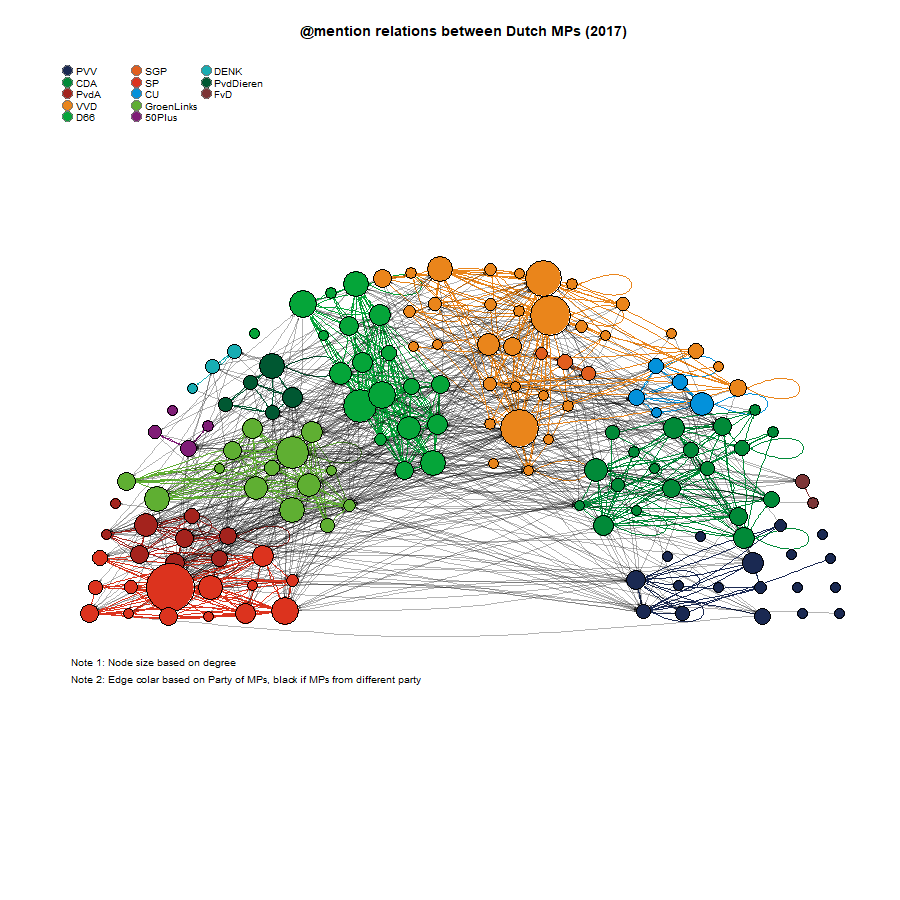
at-mention (directed)
FIXED LOCATIONS AS IN HoP
Fruchterman-Reingold layout algorithm
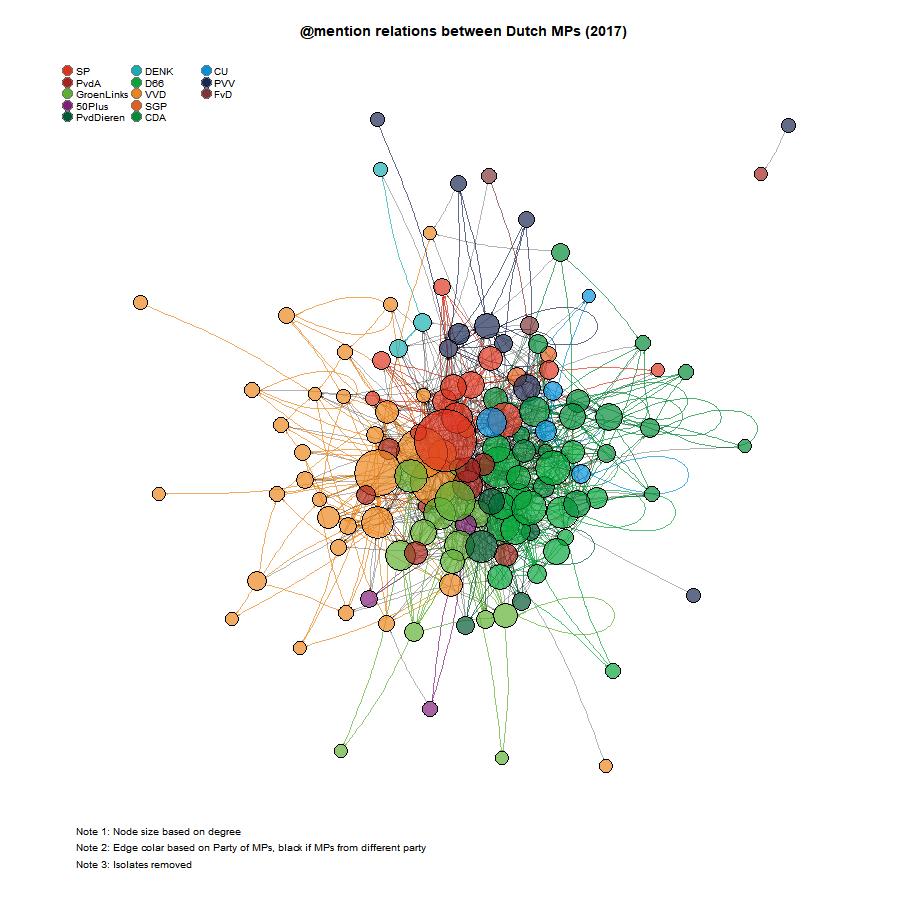
atmentions (undirected)
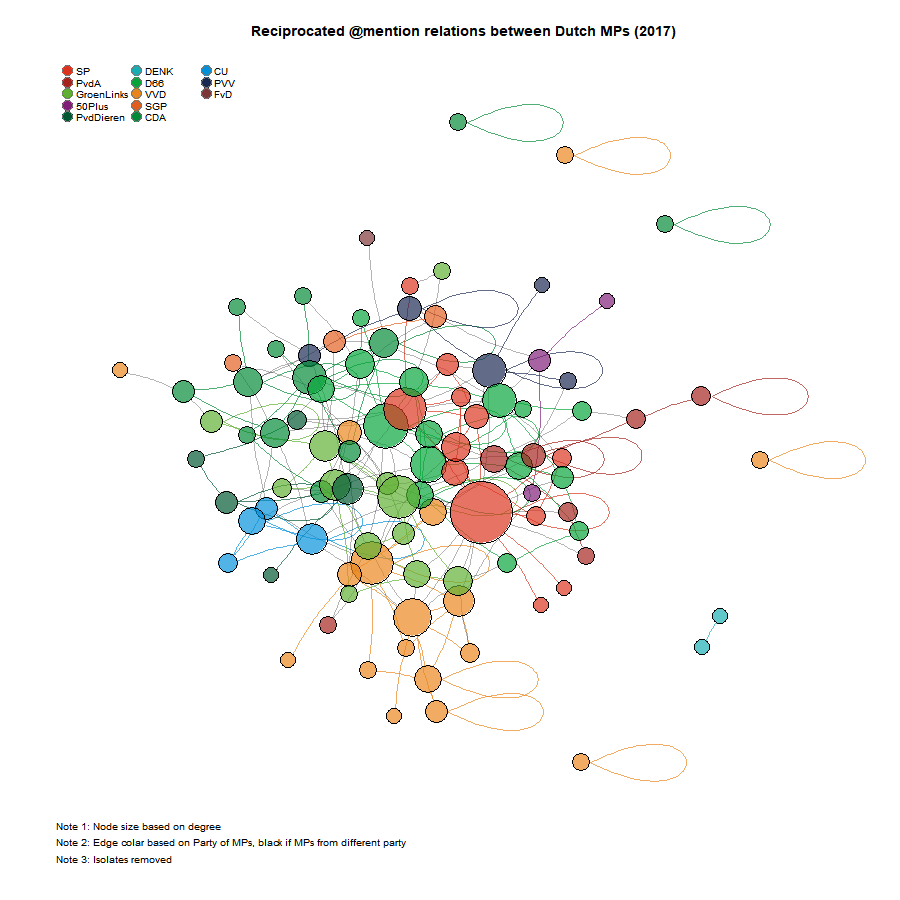
FIXED LOCATIONS AS IN HoP
G2 <- G2u

E(G2)$curved = 0.1

V(G2)$color <- keyf$Partij_col
V(G2)$size = degree(G2) * 1.05 + 6
V(G2)$label = ""

owncoords <- cbind(keyf$X, keyf$Y)
owncoords <- owncoords/8
owncoords[, 1] <- (owncoords[, 1] - mean(owncoords[, 1]))
owncoords[, 2] <- (owncoords[, 2] - mean(owncoords[, 2]))

# change color of edges based on intra or interparty ties
edges <- get.adjacency(G2)
edges_mat <- matrix(as.numeric(edges), nrow = nrow(edges))
edges_mat[lower.tri(edges_mat)] <- 0
teller <- 1
coloredges <- NA
for (i in 1:nrow(edges)) {
    for (j in 1:ncol(edges)) {
        if (edges_mat[i, j] == 1) {
            if (keyf$Partij_col[i] == keyf$Partij_col[j]) {
                coloredges[teller] <- keyf$Partij_col[i]
            }
            if (keyf$Partij_col[i] != keyf$Partij_col[j]) {
                coloredges[teller] <- "#0000004B"
            }
            teller <- teller + 1
        }
    }
}
E(G2)$color = coloredges

# prepare a legend
Party_names <- unique(keyf$Partij)
Party_cols <- unique(keyf$Partij_col)

# reorder
Party_names <- Party_names[c(7, 3, 9, 10, 12, 11, 5, 4, 6, 2, 8, 1, 13)]
Party_cols <- Party_cols[c(7, 3, 9, 10, 12, 11, 5, 4, 6, 2, 8, 1, 13)]

# png('MPplotG2uv2.png',width = 900, height= 900)
{
    plot.igraph(G2, mode = "undirected", layout = owncoords, rescale = F, margin = c(0, 0, 0, 0), xlim = c(min(owncoords[,
        1]), max(owncoords[, 1])), ylim = c(min(owncoords[, 2]), max(owncoords[, 2])), main = "Reciprocated @mention relations between Dutch MPs (2017)")

    legend("topleft", legend = Party_names, pch = 21, col = "#777777", pt.bg = Party_cols, pt.cex = 2,
        cex = 0.8, bty = "n", ncol = 3)

    text(-2.2, -1.2, "Note 1: Node size based on degree", adj = 0, cex = 0.8)
    text(-2.2, -1.3, "Note 2: Edge colar based on Party of MPs, black if MPs from different party", adj = 0,
        cex = 0.8)
}
# dev.off()
Fruchterman-Reingold layout algorithm
retweet (directed)
FIXED LOCATIONS AS IN HoP
G3 <- G3d

E(G3)$curved = 0.1
E(G3)$arrow.size = 0.1

V(G3)$color <- keyf$Partij_col
V(G3)$size = degree(G3, mode = "out") * 0.5 + 6
V(G3)$label = ""

owncoords <- cbind(keyf$X, keyf$Y)
owncoords <- owncoords/8
owncoords[, 1] <- (owncoords[, 1] - mean(owncoords[, 1]))
owncoords[, 2] <- (owncoords[, 2] - mean(owncoords[, 2]))

# change color of edges based on intra or interparty ties
edges <- get.adjacency(G3)
edges_mat <- matrix(as.numeric(edges), nrow = nrow(edges))
# edges_mat[lower.tri(edges_mat)] <- 0
teller <- 1
coloredges <- NA
for (i in 1:nrow(edges)) {
    for (j in 1:ncol(edges)) {
        if (edges_mat[i, j] == 1) {
            if (keyf$Partij_col[i] == keyf$Partij_col[j]) {
                coloredges[teller] <- keyf$Partij_col[i]
            }
            if (keyf$Partij_col[i] != keyf$Partij_col[j]) {
                coloredges[teller] <- "#0000004B"
            }
            teller <- teller + 1
        }
    }
}
E(G3)$color = coloredges

# prepare a legend
Party_names <- unique(keyf$Partij)
Party_cols <- unique(keyf$Partij_col)

# reorder
Party_names <- Party_names[c(7, 3, 9, 10, 12, 11, 5, 4, 6, 2, 8, 1, 13)]
Party_cols <- Party_cols[c(7, 3, 9, 10, 12, 11, 5, 4, 6, 2, 8, 1, 13)]

# png('MPplotG3dv2.png',width = 900, height= 900)
{
    plot.igraph(G3, mode = "undirected", layout = owncoords, rescale = F, margin = c(0, 0, 0, 0), xlim = c(min(owncoords[,
        1]) - 0.2, max(owncoords[, 1])) + 0.2, ylim = c(min(owncoords[, 2]), max(owncoords[, 2])), main = "Retweet relations between Dutch MPs (2017)")

    legend("topleft", legend = Party_names, pch = 21, col = "#777777", pt.bg = Party_cols, pt.cex = 2,
        cex = 0.8, bty = "n", ncol = 3)

    text(-2.2, -1.2, "Note 1: Node size based on degree", adj = 0, cex = 0.8)
    text(-2.2, -1.3, "Note 2: Edge colar based on Party of MPs, black if MPs from different party", adj = 0,
        cex = 0.8)
}
# dev.off()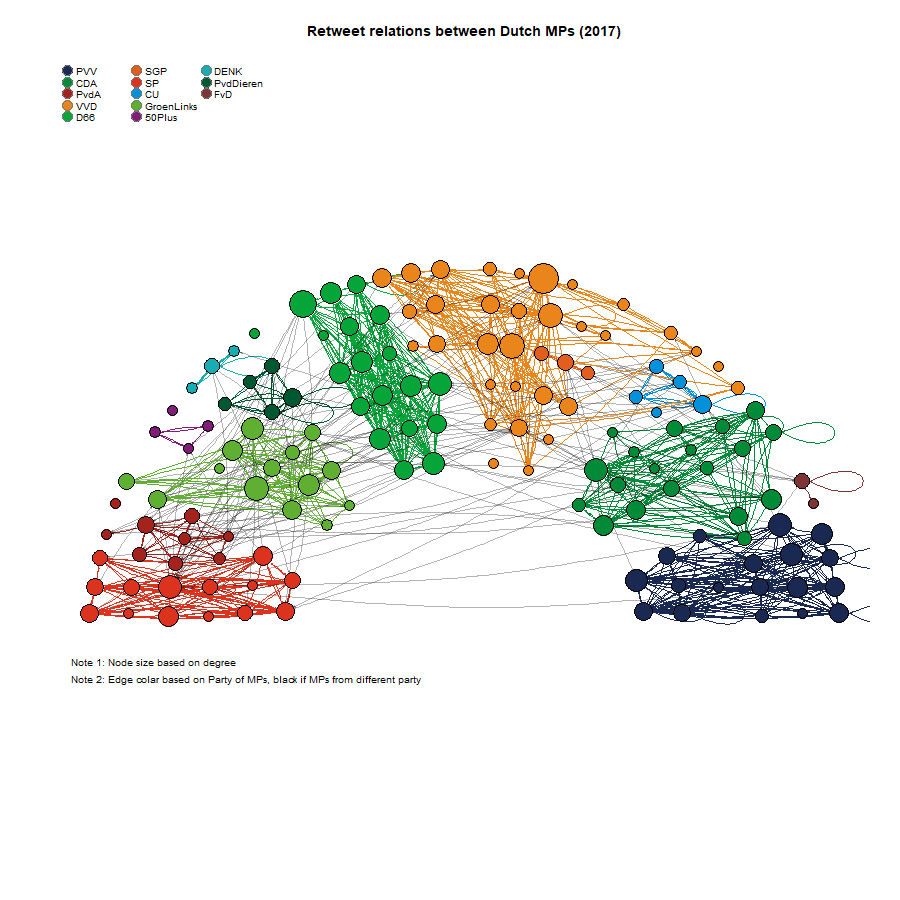
Fruchterman-Reingold layout algorithm
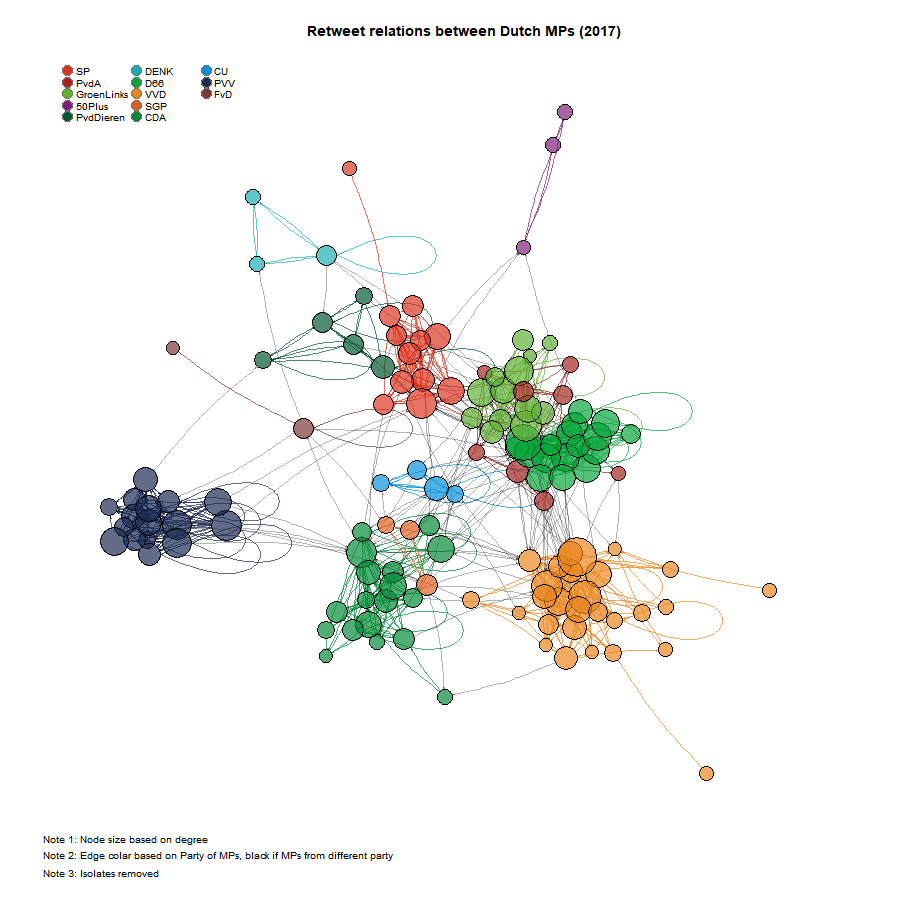
retweet (undirected)
FIXED LOCATIONS AS IN HoP
G3 <- G3u

E(G3)$curved = 0.1

V(G3)$color <- keyf$Partij_col
V(G3)$size = degree(G3) * 1.05 + 6
V(G3)$label = ""

owncoords <- cbind(keyf$X, keyf$Y)
owncoords <- owncoords/8
owncoords[, 1] <- (owncoords[, 1] - mean(owncoords[, 1]))
owncoords[, 2] <- (owncoords[, 2] - mean(owncoords[, 2]))

# change color of edges based on intra or interparty ties
edges <- get.adjacency(G3)
edges_mat <- matrix(as.numeric(edges), nrow = nrow(edges))
edges_mat[lower.tri(edges_mat)] <- 0
teller <- 1
coloredges <- NA
for (i in 1:nrow(edges)) {
    for (j in 1:ncol(edges)) {
        if (edges_mat[i, j] == 1) {
            if (keyf$Partij_col[i] == keyf$Partij_col[j]) {
                coloredges[teller] <- keyf$Partij_col[i]
            }
            if (keyf$Partij_col[i] != keyf$Partij_col[j]) {
                coloredges[teller] <- "#0000004B"
            }
            teller <- teller + 1
        }
    }
}
E(G3)$color = coloredges

# prepare a legend
Party_names <- unique(keyf$Partij)
Party_cols <- unique(keyf$Partij_col)

# reorder
Party_names <- Party_names[c(7, 3, 9, 10, 12, 11, 5, 4, 6, 2, 8, 1, 13)]
Party_cols <- Party_cols[c(7, 3, 9, 10, 12, 11, 5, 4, 6, 2, 8, 1, 13)]

# png('MPplotG3uv2.png',width = 900, height= 900)
{
    plot.igraph(G3, mode = "undirected", layout = owncoords, rescale = F, margin = c(0, 0, 0, 0), xlim = c(min(owncoords[,
        1]) - 0.2, max(owncoords[, 1])) + 0.2, ylim = c(min(owncoords[, 2]), max(owncoords[, 2])), main = "Reciprocated retweet relations between Dutch MPs (2017)")

    legend("topleft", legend = Party_names, pch = 21, col = "#777777", pt.bg = Party_cols, pt.cex = 2,
        cex = 0.8, bty = "n", ncol = 3)

    text(-2.2, -1.2, "Note 1: Node size based on degree", adj = 0, cex = 0.8)
    text(-2.2, -1.3, "Note 2: Edge colar based on Party of MPs, black if MPs from different party", adj = 0,
        cex = 0.8)
}
# dev.off()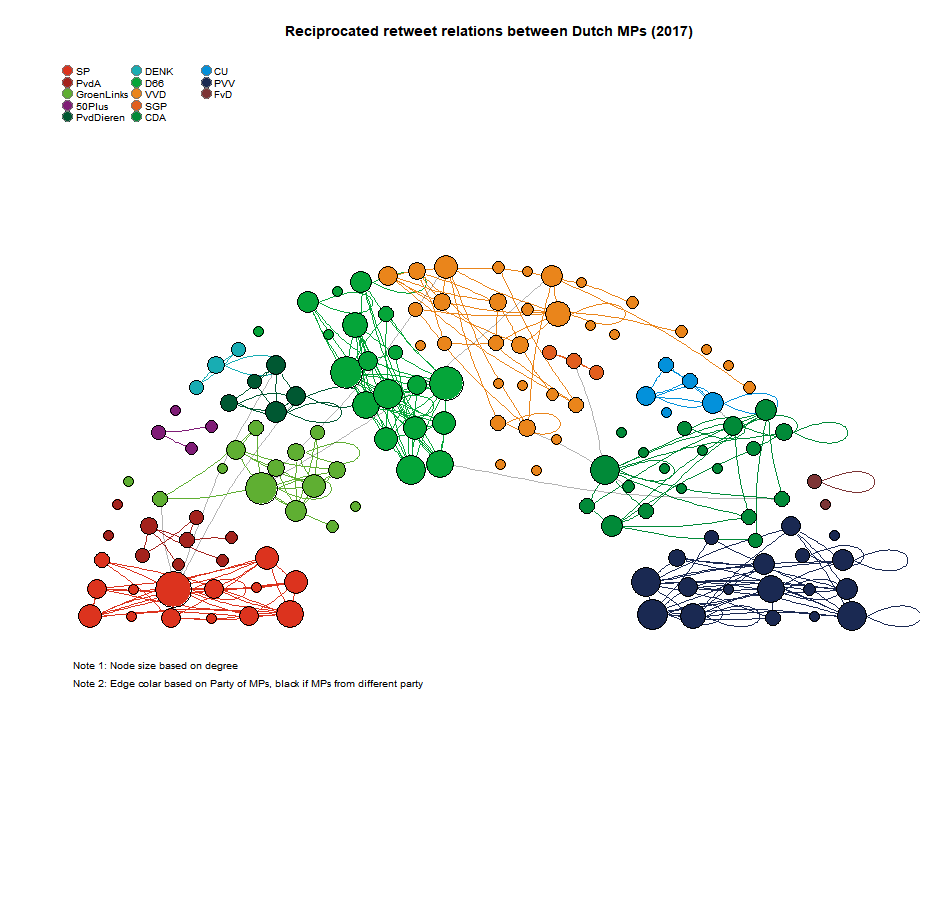
Fruchterman-Reingold layout algorithm
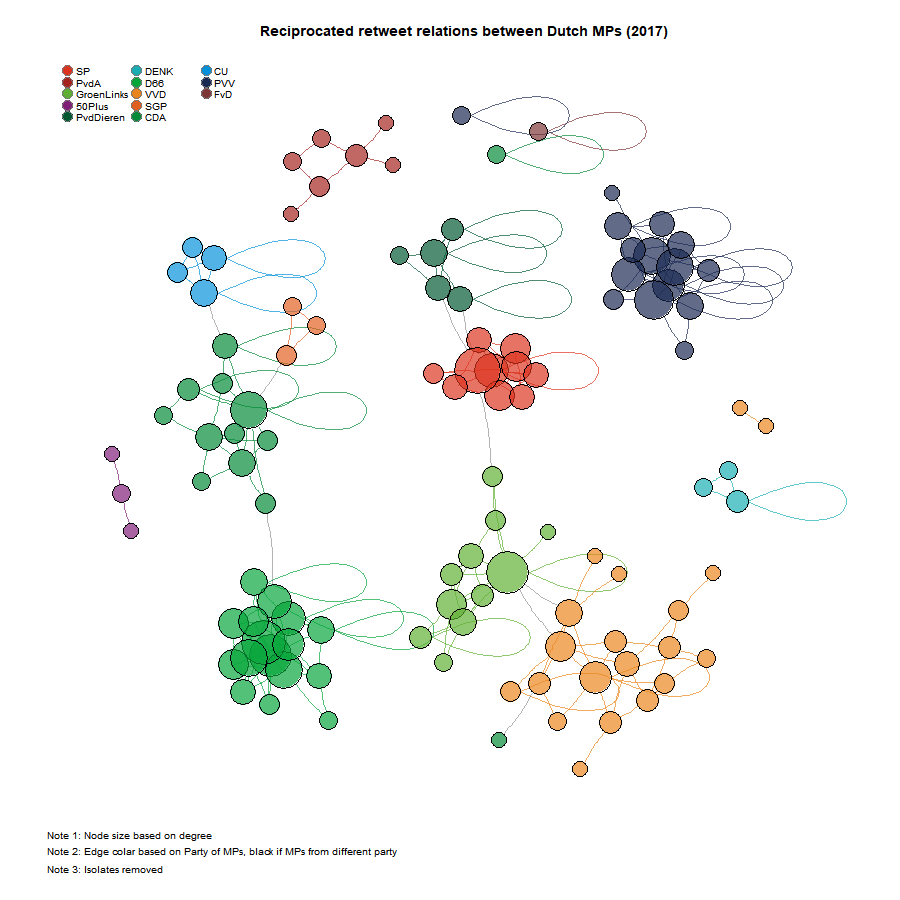
Rank orders and description
Most follower outdegrees:
G1 <- G1d
foutdegree <- degree(G1, mode = "out")
keyf$Partij[which(foutdegree == max(foutdegree))]
keyf$Naam[which(foutdegree == max(foutdegree))]
#> [1] CDA
#> 19 Levels: Artikel1 CDA CU DENK D66 FvD GeenPeil GroenLinks Piraten PvdA PvdDieren PVV SGP ... uit fractie getreden, zonder partij als eenmansfractie
#> [1] Heerma, Pieter
#> 969 Levels: Stephan van Baarle ... Zohair el YassiniMost atmention outdegrees:
G2 <- G2d
atmdegree <- degree(G2, mode = "out")
keyf$Partij[which(atmdegree == max(atmdegree))]
keyf$Naam[which(atmdegree == max(atmdegree))]
#> [1] SP
#> 19 Levels: Artikel1 CDA CU DENK D66 FvD GeenPeil GroenLinks Piraten PvdA PvdDieren PVV SGP ... uit fractie getreden, zonder partij als eenmansfractie
#> [1] PETER KWINT
#> 969 Levels: Stephan van Baarle ... Zohair el YassiniMost retweet outdegrees:
G3 <- G3d
rtdegree <- degree(G3, mode = "out")
keyf$Partij[which(rtdegree == max(rtdegree))]
keyf$Naam[which(rtdegree == max(rtdegree))]
#> [1] VVD
#> 19 Levels: Artikel1 CDA CU DENK D66 FvD GeenPeil GroenLinks Piraten PvdA PvdDieren PVV SGP ... uit fractie getreden, zonder partij als eenmansfractie
#> [1] Dilan Yesilgöz-Zegerius
#> 969 Levels: Stephan van Baarle ... Zohair el YassiniSpearman’s rank correlation rho
follower outdegree and atmention outdegree
cor.test(foutdegree, atmdegree, method = "spearman")#>
#> Spearman's rank correlation rho
#>
#> data: foutdegree and atmdegree
#> S = 322905, p-value = 1.042e-06
#> alternative hypothesis: true rho is not equal to 0
#> sample estimates:
#> rho
#> 0.3900495follower outdegree and retweet outdegree
cor.test(foutdegree, rtdegree, method = "spearman")#>
#> Spearman's rank correlation rho
#>
#> data: foutdegree and rtdegree
#> S = 336405, p-value = 5.641e-06
#> alternative hypothesis: true rho is not equal to 0
#> sample estimates:
#> rho
#> 0.3645494retweet outdegree and atmention outdegree
cor.test(rtdegree, atmdegree, method = "spearman")#>
#> Spearman's rank correlation rho
#>
#> data: rtdegree and atmdegree
#> S = 249178, p-value = 5.475e-12
#> alternative hypothesis: true rho is not equal to 0
#> sample estimates:
#> rho
#> 0.529317Copyright © 2021 Jochem Tolsma